Will Renewables Survive the Energy Transition?
Key Takeaways
- Major changes to economic sectors as the energy transition plays out will have significant implications for longer-term portfolios and will require an awareness of the risk/return proposition within allocations exposed to these changes.
- Policy risk related to the cost of living will affect the electricity value chain — and investors in that value chain — unevenly.
- While funding for the energy transition, likely exacerbating the cost of living crisis, threatens to reduce returns for subsidy-reliant parts of the electricity value chain, our contention is that regulators will continue to provide attractive returns for regulated utilities.
The energy transition and decarbonisation continue apace, entailing major changes to sectors such as energy, power and transport. According to the IEA, reaching net zero by 2050 will involve emissions from the power sector declining as solar and wind expand and coal plants are shuttered. Supply from solar and wind is expected to rise from 27% to 60%, while the increase in renewables will reduce the carbon intensity of electricity generation by 60%.
Accordingly, power sector investment will triple, with more than half of it spent on renewables, and one-third of it spent to update electricity networks. Further, 65% of all cars sold annually will be EVs. In terms of electricity demand, two EVs are equal to one house being added to the grid. Such growth in EVs will involve considerable spending on poles, wires and transformers in the streets of our major cities to support the increased current required to charge.
All of these changes will have significant implications for investors with longer-term portfolios and will require an awareness of the risk/return proposition within allocations exposed to these changes. Our contention is that, when looking at risk-adjusted return, regulated utilities are the best sector for exposure to the energy transition.
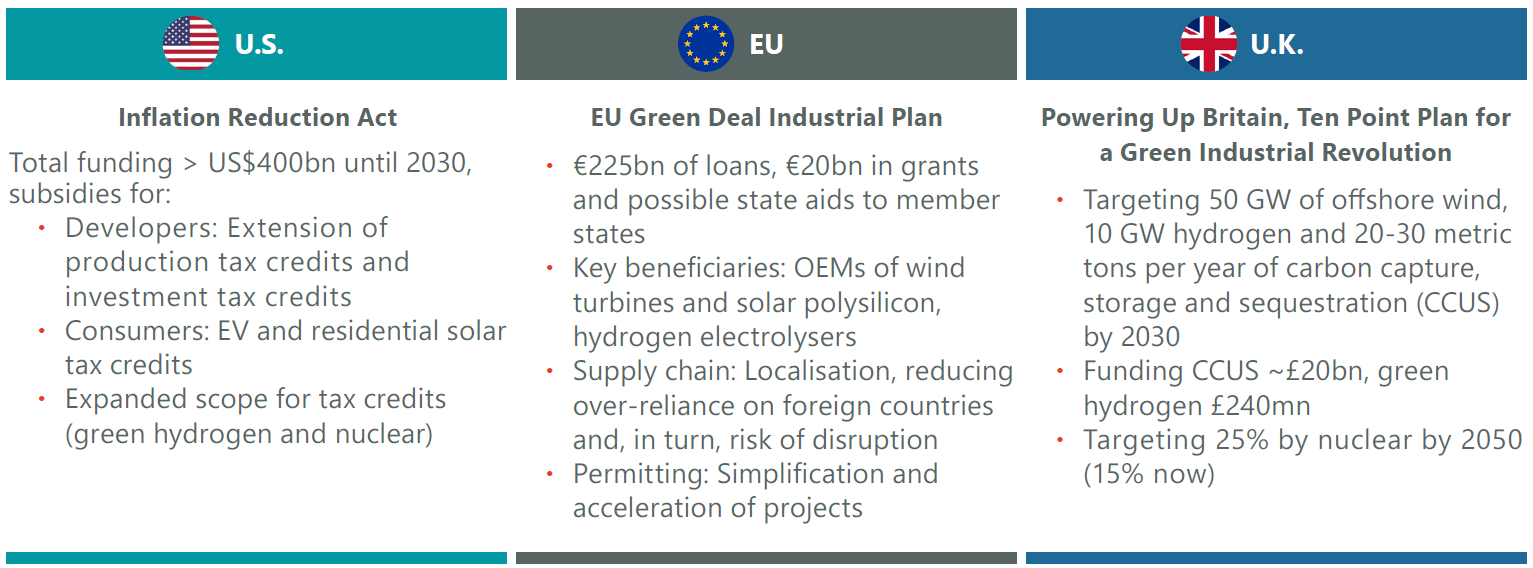
Exhibit 1: Energy Transition Public Policy Highlights by Region

As of 31 December 2023. Source: White House, European Commission, U.K. Parliament and ClearBridge Investments.
Public Policy and Financing the Energy Transition
Behind many of the changes outlined above will be public policy, which seeks to move the economy’s energy demand away from oil and gas toward electricity and then power the grid with as much renewable energy as it can take. Governments have large targets, such as the RePowerEU’s target for 750 GW of solar energy by 2030, from a current ~200 GW. Other major policy highlights that will affect investors include the U.S. Inflation Reduction Act (IRA), the EU’s Green Deal Industrial Plan and the U.K.’s Powering Up Britain (Exhibit 1).
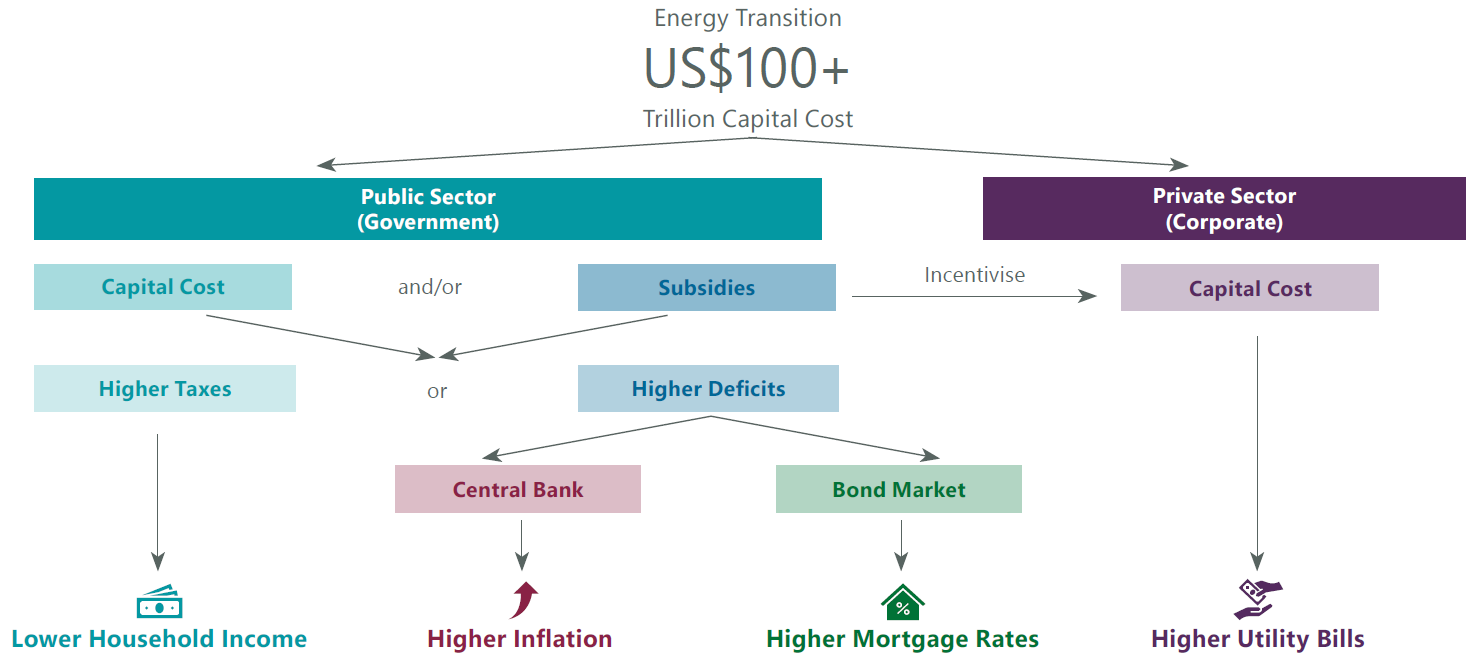
Public policy’s approach will be to use some taxpayer funds to subsidise particular technologies to drive investment into renewables and streamline environmental and siting approval processes to ensure projects can be executed expeditiously. There are a few approaches to doing so. The private sector can play a role and pay the upfront cost, but that capital will need a return, and this will lead to higher utility bills in the future.
Government subsidies are another option, as in the IRA and the EU Green Deal, which may ameliorate increases in utility bills. Alternatively, governments could undertake the capital expenditure themselves. It is likely that governments around the world will use a variety of approaches (Exhibit 2), tailored to their particular resources, requirements and constraints.
However, there are consequences to this, as anything the government spends, such as subsides or upfront capital costs, need to be funded. Governments can either do this through higher taxes or higher deficits. Neither is without repercussions for households. Higher taxes end up squeezing household income, while higher deficits, likely funded through the bond market, where higher issuance likely leads to higher sovereign yields, will lead to higher mortgage and related consumer borrowing costs.
Deficits could also be funded through central banks, through some form of quantitative easing or yield curve control, although recently that has led to inflation and a global cost of living crisis.
While support for green policy from younger demographics generally bodes well for the energy transition and fighting climate change, the cost of living remains a major issue, and one that government spending exacerbates. Higher costs of living may even begin to deter younger voters from supporting government funding for the energy transition in the future since cost of living pressures will hit them just as they are forming households and having children. This may put policy funding, or subsidies, at risk.
Here, however, is where investors with longer-term portfolios run a higher risk: by assuming the current or imminent investment environment will continue over the long term.
Exhibit 2: Financing the Energy Transition Is Challenging

Source: ClearBridge Investments.
The Electricity Value Chain and Policy Risk
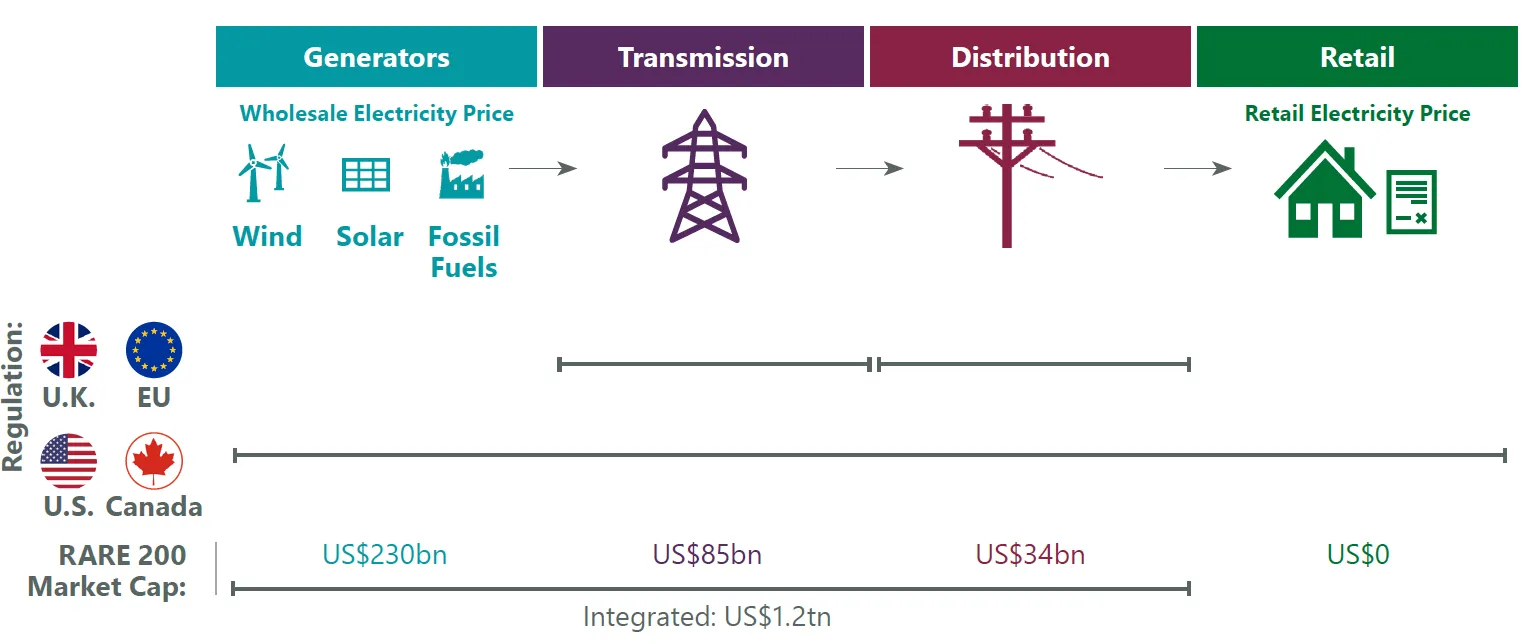
The electricity value chain spans the gamut from generators (such as solar and wind farms, gas-powered turbines) to transmission (towers that hold up power lines) to distribution (utility poles) to retail delivery at the household or site of use. Likewise, different types of investors are concentrated in different segments (Exhibit 3).
Policy risk related to the cost of living will affect the electricity value chain — and investors in that value chain — unevenly. Over half all funds raised in private infrastructure in 2022 were tagged “renewables,” which means a considerable amount of private or unlisted infrastructure capital is being invested in the generation segment of this electricity value chain. The generation segment is also the recipient of most of the subsidies to build renewable capacity, which we believe to be at higher risk of policy pushback as cost of living pressures from funding the energy transition rise.
ClearBridge’s electricity investment universe, by contrast, is mostly made up of regulated utilities (85%), which have assets across the value chain (generation, transmission and distribution), and some unregulated generators that have long-term power purchase agreements, or PPAs, underpinning their revenues (15%).
Exhibit 3: Electricity Value Chain

Source: ClearBridge Investments, Bloomberg Finance.
Regulated Utilities a Better Long-Term Risk/Return Proposition than Generation
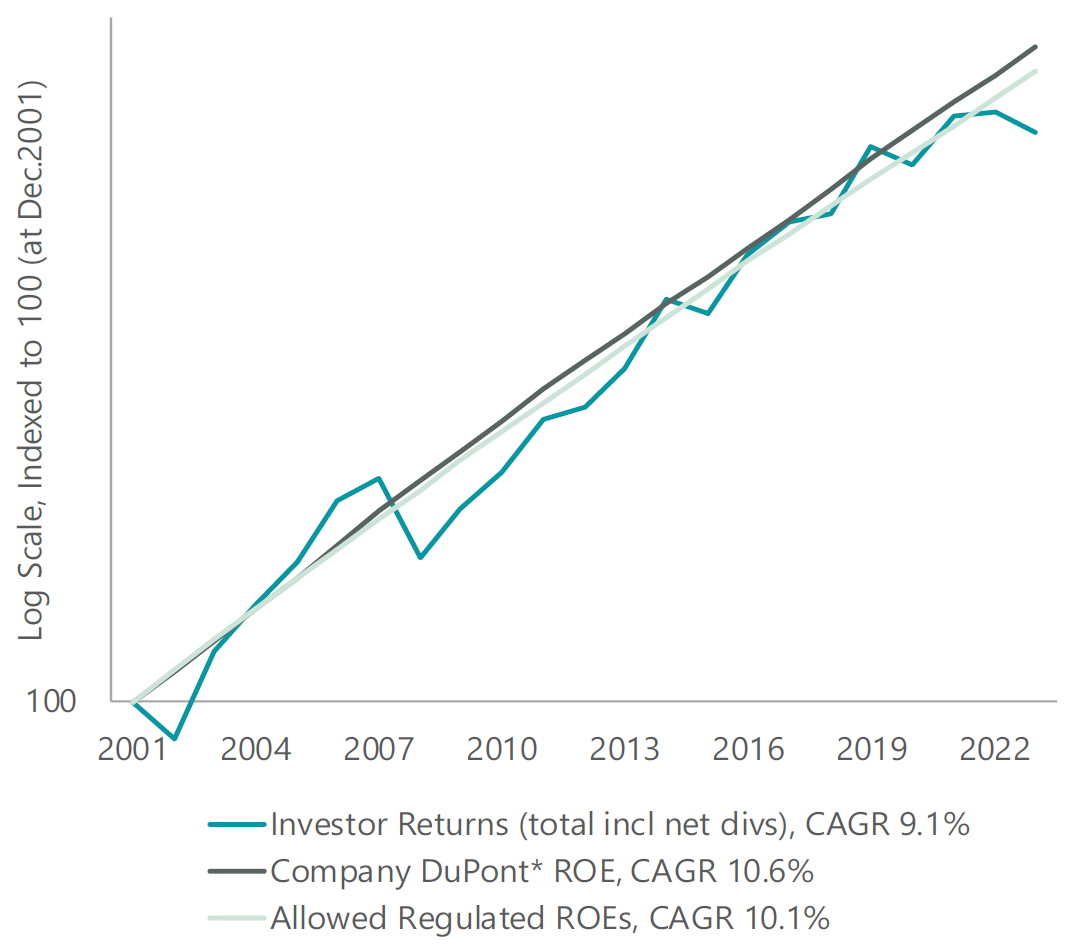
New capital, meanwhile, will be required across the entire electricity value chain, with estimates of US$2.5 trillion per year by 2030 (in 2019 dollars) per the IEA. While the predominantly private-funded generation segment will face increased risk of funding being taken away as the political reaction to higher costs of living threatens subsidies currently supporting their buildout, investor returns in regulated entities across the electricity value chain, or broadly listed infrastructure, look to be much safer, as their returns tend to follow regulator-allowed returns on equity (ROE) over time (Exhibit 4).
This is due to the nature of regulated assets, whose revenues are normally determined by a regulator-allowed ROE on an underlying asset base, which is in turn determined by the level of investment.
Exhibit 4: Regulated Allowed Returns, Reported ROEs and Investor Returns: North American Utilities

As of 31 December 2023. Source: ClearBridge Investments, Bloomberg Finance. Returns are post-tax nominal, implied by regulated allowed returns, compared with listed company reported ROEs and total returns (income and capital) received by investors. * DuPont ROE = Net Income / Tangible Assets x Financial Leverage Ratio, all Bloomberg reported measures.
While funding for the energy transition, likely exacerbating the cost of living crisis, threatens to reduce returns for subsidy-reliant parts of the electricity value chain, our contention is that regulators will continue to provide attractive returns for regulated utilities. This argues for listed infrastructure exposure, which also ensures liquidity to adjust positioning in a market that will be more dynamic than many expect, and where investors will also need to be aware of the possibility that some assets become stranded.
With policy risks lower for listed infrastructure such as regulated utilities, on a risk-adjusted basis, we believe such assets are a preferable way to get exposure to the growing energy transition.
Related Perspectives

Infrastructure Outlook: AI, Decarbonisation and Policy Tailwinds in 2026
Structural tailwinds like decarbonisation, network upgrades and climate-proofing, along with AI’s need for power, are fuelling long-term capital expenditure cycles for infrastructure.
Read full article